The geotechnical contrast between Vieux-Longueuil's compact glacial till and the deep Champlain Sea clay deposits near the Saint Lawrence River in LeMoyne dictates every foundation decision we make. What works on the terrace gravels won't necessarily perform three kilometers north where the marine silt can extend past twenty meters. A thorough grain size analysis—combining mechanical sieving for the coarse fraction and hydrometer sedimentation for fines—is the only way to quantify that variability. We run the full ASTM D422 procedure because partial gradation curves, the kind you get from a quick field shake test, won't tell you enough about drainage potential or frost susceptibility. In our experience across the South Shore, the split between sand and fines often shifts within a single borehole, and knowing exactly where that boundary sits changes the footings design parameters and the required compaction specs.
A complete sieve-plus-hydrometer curve reveals far more than sand-silt-clay percentages—it governs permeability estimates, frost-heave potential, and the selection of filter materials for subsurface drainage.
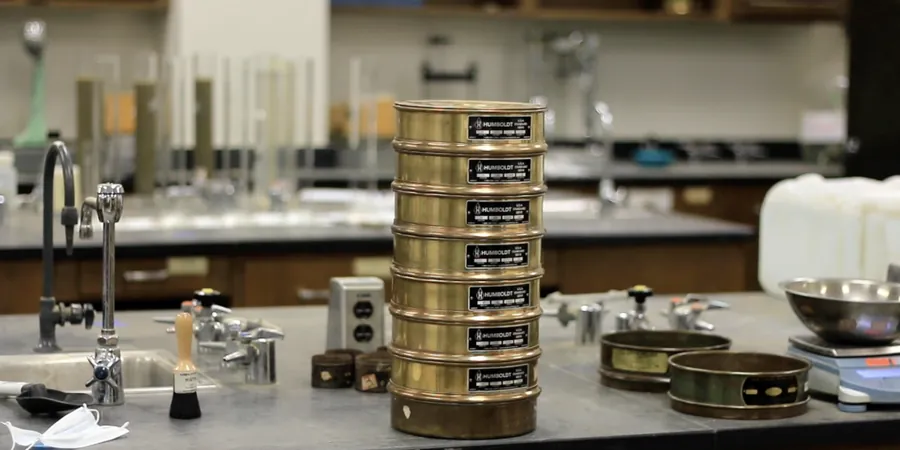
Methodology and scope
Longueuil's urban expansion after the 1960s, when farmland and orchard tracts were rapidly converted into residential subdivisions, left a patchwork of engineered fill over the original post-glacial stratigraphy. We routinely encounter layers where imported granular material sits directly on sensitive silty clay, and without a complete grain size distribution curve, that interface is easy to misinterpret. Our laboratory procedure starts with a representative split of the sample, dried and weighed, then passed through a stack of sieves from 75 mm down to 75 microns. The minus-200 fraction goes into a sedimentation cylinder with sodium hexametaphosphate dispersant, and we take hydrometer readings at precise time intervals per ASTM D7928. The resulting combined curve gives us D10, D30, and D60 values that feed directly into the coefficient of uniformity and coefficient of curvature—numbers that a
triaxial shear strength correlation or a
Proctor moisture-density relationship can't be properly interpreted without. For Longueuil's typical silty fine sands, we often see Cu values between 2 and 8, indicating a poorly to uniformly graded material that demands careful drainage planning.
Frequently asked questions
What is the typical cost for a grain size analysis with hydrometer in Longueuil?
For a standard sieve-plus-hydrometer package following ASTM D422, the fee ranges from CA$140 to CA$280 per sample, depending on whether we are processing a single point or batch testing for a larger investigation. The hydrometer-only option sits at the lower end of that range.
How long does it take to get results from a sieve and hydrometer test?
The hydrometer sedimentation phase alone requires a minimum of 24 hours for readings, and with oven-drying, sieving, and data reduction, we typically deliver the final gradation report within three to five business days. Expedited processing can shorten that to two days when the project schedule demands it.
Why is the hydrometer test necessary if the soil looks sandy?
Even sands that appear clean in the field often carry five to fifteen percent fines, and that small fraction controls drainage behavior and frost susceptibility. In Longueuil's post-glacial soils, the hydrometer quantifies how much of that passing material is silt versus true clay, which directly impacts permeability estimates and the design of subgrade drains.
Do you provide the grain size distribution in digital format for modeling software?
Yes, we can output the complete gradation table and semi-log plot as a CSV file, PDF report, or directly in formats compatible with common geotechnical software packages. The D10, D30, and D60 values are always tabulated for immediate use in filter design and seepage analysis.